
By Donald Luverne
Every operator has taken a load that looked fine and didn't pencil out. The rate seemed reasonable. The miles were there. You had a return load lined up. And somewhere between accepting it and getting paid, the math stopped working. Fuel was higher than expected. The empty miles to pickup ate into the margin. The lumper came out of your pocket. By the time you settled up, you moved freight for less than it cost you to move it.
That happens to experienced operators. Not because they're careless, but because the calculation is genuinely complicated. Your break-even rate isn't a fixed number — it shifts based on your current cost structure, your fuel price, your empty mile exposure, and what your target margin is. Doing that math accurately in your head, in real time, on a load board with a broker waiting for an answer, is harder than it looks.
The Load Check tab in the Cost Per Mile Analyzer does that calculation instantly, every time, using your actual numbers.
The Load Check tab pulls your current break-even rate directly from your most recent saved month in history. That means it's always using your real cost structure — not a generic estimate, not a number you entered six months ago. Your actual CPM, your actual fixed costs, your actual variable costs per mile, updated every time you save a new month.
To evaluate a load, you enter four things: the origin, the destination, the loaded miles, and the quoted rate. The tab calculates your revenue per mile instantly, compares it to your break-even rate, shows your estimated margin on the load, and gives you a clear GO or NO-GO decision. No formula to build. No spreadsheet to set up. Just enter the load details and get the answer.
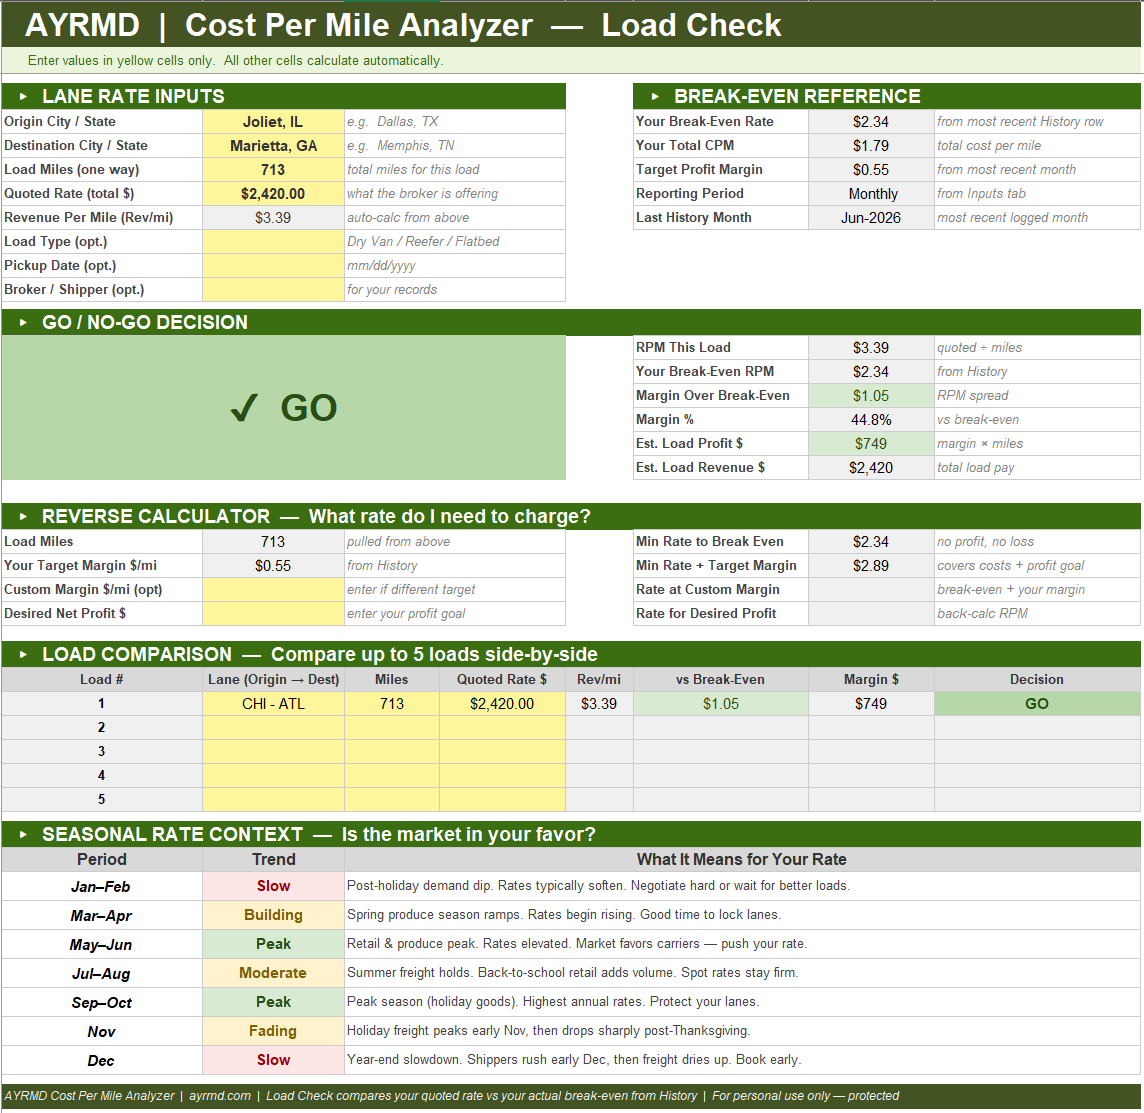
Sometimes the question isn't whether a specific rate works — it's what rate you need to make a lane work. The reverse calculator handles that. Enter the miles and it shows you three numbers: the minimum rate to break even with no profit, the rate needed to cover your costs plus your target margin, and the rate required to hit a specific dollar profit goal on that load.
That last number is the one worth knowing before you counter-offer. When a broker comes in low and you need to push back, having the exact dollar figure that makes the load worth taking gives you a clear floor to negotiate from. Not a gut feeling. A calculated number based on what it actually costs you to move that freight.
The comparison grid lets you evaluate up to five loads simultaneously. Enter each load's lane, miles, and quoted rate and the grid shows revenue per mile, margin versus break-even, estimated profit, and GO or NO-GO for each load side by side. When you're looking at multiple options on the board and trying to pick the best one, the comparison grid makes the decision straightforward.
It also surfaces things that aren't obvious when you're evaluating loads one at a time. A load that looks competitive in isolation sometimes looks different when you can see it next to four alternatives. The highest gross isn't always the best margin. The shortest run isn't always the most efficient. The grid shows you all of it at once.
At the bottom of the Load Check tab, a seasonal reference table shows historical freight patterns by month — which periods typically favor carriers, which favor shippers, and what to expect in terms of rate pressure across the calendar year. It's not a rate forecast. It's context for understanding whether the rate you're being offered is reasonable given where the market typically sits at this time of year.
Combined with the Market Intelligence button in the AI Advisor, which pulls current rate data and connects it to your cost structure, you have both the historical pattern and the current reality to work from when you're evaluating whether a lane is worth running.
One bad load decision a week at a $200 margin loss is $10,000 a year. Most operators who've been at this for a while can think of specific loads they took that cost them more than that in a single run. The Load Check tab doesn't eliminate bad loads from the market. But it eliminates the possibility of taking one without knowing it's bad first.
At $19 for the entire Cost Per Mile Analyzer — Load Check included, no subscription, no additional fees — it pays for itself the first time it catches a load that doesn't work before you've already committed to it.
If you've ever rolled out on a load that felt right and found out later it wasn't, this is the tool that keeps that from happening again.